

Terrain hydrology, part 3 of 3
Wetness, stream power and sediment connectivity
Combine contributing area and slope into the topographic wetness, stream power and sediment transport indices, and map how strongly every hillslope is connected to the streams with the index of connectivity.
- Level
- Intermediate
- Time
- 45 min
In this part you compute the terrain indices that ecologists use most as proxies of soil water and erosion: the topographic wetness index, the stream power index and the sediment transport index, all three built from the contributing area of part 1 and the local slope. Then you map the index of connectivity, which asks how easily sediment from each hillslope reaches a stream, give it a cover weight from a vegetation map, and see what clearing the riparian forest would do to it. At the end you will know what each index measures, which flow method to use for each, and how to report them so that others can reproduce your numbers.
The idea#
Two numbers describe the water arriving at a point of a hillslope: how much land drains to it, and how steep it is there. Much land and a gentle slope: water collects faster than it drains away, and the soil stays wet. Much land and a steep slope: the water runs fast and has power to erode. Little land: the soil drains and dries. The indices of this page are combinations of these two numbers.
The land is measured by the specific contributing area \( a \): the area that drains through a cell, divided
by the width of the contour it crosses (the width of a cell), in m²/m (part 1, units = sca). Dividing by the
width makes it independent of the resolution: it is the area that drains through each metre of contour. The
slope \( \beta \) is the local slope of the cell, from Horn's (1981) method.
Key idea: the topographic wetness index
Beven & Kirkby (1979) built the hydrological model TOPMODEL on the idea that the depth of the water table at a point depends on
where \( a \) is the specific contributing area (m²/m) and \( \tan \beta \) the slope as a gradient (metres of fall per metre). Places with the same TWI respond alike: they become saturated at the same level of the water table. TWI is high (10 to 15) in valley floors and hollows, where much area drains through a gentle slope, and low (4 to 6) on ridges and steep convex slopes. It is a logarithm, so a difference of 1 is a factor of 2.7 in the ratio of area to slope.
Moore, Grayson & Ladson (1991) reviewed the family of such compound terrain indices and their uses in hydrology, geomorphology and biology. Two others, for erosion:
Key idea: stream power and sediment transport
The stream power index is proportional to the power of the overland flow, its ability to erode:
The sediment transport index of Moore & Burch (1986) is the length–slope factor LS of the Universal Soil Loss Equation rewritten with the contributing area instead of the length of a plot:
with \( m = 0.4 \) and \( n = 1.3 \) by default. 22.13 m and 0.0896 (a slope of 9 %, \( \sin \beta \)) are the length and slope of the standard plot of the USLE, so an STI of 1 means "as erosive as the standard plot", 10 means ten times as much.
The last index is about connections rather than amounts. Borselli, Cassi & Torri (2008) asked how likely sediment eroded on a cell is to reach a stream, and answered with the index of connectivity (IC); Cavalli et al. (2013) adapted it to high-resolution DEMs of Alpine catchments, and InVEST's sediment delivery ratio model uses it to decide what share of each cell's soil loss reaches the streams (Hamel et al., 2015).
Key idea: the index of connectivity
The upslope component \( D_{up} \) is the potential for sediment to come down to the cell: \( A \) the contributing area (m²), \( \bar{W} \) the mean weight and \( \bar{S} \) the mean slope gradient of the area upslope. The downslope component \( D_{dn} \) is the resistance of the path from the cell to the nearest stream: the sum, over the cells \( i \) of that path, of the length \( d_i \) of each step divided by the weight and slope of the cell. The weight \( W \) is a cover factor between 0 and 1 that slows sediment, in InVEST the USLE's C of each land use: 0.001 to 0.01 under dense forest, much higher on bare or cropped land. IC rises (towards 0 and above) where a large, steep, bare area lies close to a stream along a steep, bare path, and falls (large negative numbers) where the path to the stream is long, gentle and covered.
When to use it#
- Soil moisture and wetland plants. TWI is one of the most common covariates of species distribution models of plants, bryophytes and amphibians, and of maps of wet soils and peat. In temperate forest plots, Kopecký, Macek & Wild (2021) found that a TWI computed with FD8 explained more than twice the variation in measured soil moisture and in the composition of vascular plants and bryophytes than one computed with D8.
- Where gullies and erosion start. High SPI marks the hollows and channel heads where concentrated flow can erode; STI is a map of the LS factor for soil loss studies.
- Where to put buffers and restoration. IC shows the hillslopes whose sediment reaches the streams most easily: the first candidates for riparian buffers, reforestation or erosion control, and the places where a clearing would hurt the streams most.
- InVEST.
hydro.connectivity_indexis the IC of InVEST's sediment delivery ratio model, computed the same way; use it to understand that model or to build variants of it (Ecosystem services).
What they are not: TWI assumes a water table parallel to the surface and soils of uniform conductivity, so it
works best in humid landscapes with shallow soils over impermeable rock and worst on deep, permeable or flat
land. SPI and STI rank places by erosion potential; they are not soil loss in tonnes (for that, see the RUSLE of
InVEST's services.sdr or SWAT+ in part 4). IC is a relative index: compare it within a map
and between scenarios on the same map, not as an absolute measure between regions.
What you need#
- The filled DEM of part 1:
filled.tif, the Oregon SRTM elevation reprojected to UTM 10N in cells of 30 m and filled, as part 1'ssave_fillednode writes it. - A projected DEM, for the index of connectivity: it takes the size of its cells from the map's coordinates as they are, so a map in degrees would give areas in square degrees. TWI, SPI and STI take cells in metres either way.
- A cover weight for IC: here made from the summer NDVI of the same area (
ndvi.tif, as in part 1), forest above 0.55, open land below.
Build the model#
Wetness, stream power and sediment transport#
- Start a new model with a
raster.read(subject IO) offilled.tif, renamedfilled. - Select
filledand, in the library's subject Terrain hydrology, clickhydro.twi,hydro.spiandhydro.sti. Each comes connected tofilled's raster; rename themtwi,spiandsti. - Run to each (Ctrl+Enter).
Model file (TOML)
format = "terraflux/1"

[[nodes]]
id = "filled"
op = "raster.read"
params = { path = "filled.tif" }

[[nodes]]
id = "twi"
op = "hydro.twi"
inputs = { dem = "filled.raster" }
params = { method = "fd8" }
note = "ln(a / tan slope)"

[[nodes]]
id = "spi"
op = "hydro.spi"
inputs = { dem = "filled.raster" }
note = "a x tan slope"

[[nodes]]
id = "sti"
op = "hydro.sti"
inputs = { dem = "filled.raster" }
params = { sca_exponent = 0.4, slope_exponent = 1.3 }
note = "The LS factor from the area."
Each of the three operators computes its two parts itself from the DEM: the specific contributing area by the
accumulation method (fd8 by default, also quinn, dinf, d8 and mfd, as in part 1) and the slope
by Horn's method. The results are WhiteboxTools' WetnessIndex, StreamPowerIndex and
SedimentTransportIndex cell for cell. The other settings:
- min_slope (
hydro.twionly): a floor for \( \tan \beta \). On perfectly flat cells \( \tan \beta = 0 \) and the TWI is infinite, so they get no value (here 155 cells, the flat floors of filled depressions). A floor such as0.001gives them a high, finite value. - sca_exponent and slope_exponent (
hydro.stionly): \( m \) and \( n \). Moore & Burch's 0.4 and 1.3 are the usual values. - flats: drain flat areas (on by default; leave it on with a filled DEM).
Two optional inputs replace the parts: sca, a specific contributing area made your own way, and slope, a
slope in degrees. That is how to follow a recipe exactly. Kopecký et al. (2021) recommend FD8 with a flow
dispersion (the exponent of hydro.flow_accumulation) close to 1.0, the flow width equal to the cell
size, and the local slope; Terraflux's default exponent is Freeman's 1.1. For their recipe:
Model file (TOML)
format = "terraflux/1"

[[nodes]]
id = "filled"
op = "raster.read"
params = { path = "filled.tif" }

[[nodes]]
id = "sca"
op = "hydro.flow_accumulation"
inputs = { dem = "filled.raster" }
params = { method = "fd8", exponent = 1.0, units = "sca" }
note = "m²/m, the area per metre of contour."

[[nodes]]
id = "twi"
op = "hydro.twi"
inputs = { dem = "filled.raster", sca = "sca.map" }
On this map the difference is small (the two TWIs correlate at 0.9999, the recipe's is higher by 0.02 on average), but stating it makes your index reproducible.
The index of connectivity#
- Add a
raster.readofndvi.tif(ndvi_read) and araster.reprojectafter it (ndvi) with the settings of part 1: crsEPSG:32610, resolution30, resamplingbilinear, extent[500010, 4760850, 508110, 4771920], so that it lies on the grid offilled.tif. - Add a
raster.calcnamedcoverwith inputnfromndviand the expression0.003 if n > 0.55 else 0.05: the weight \( W \), a cover factor of 0.003 under forest and 0.05 on open land. - Add
hydro.connectivity_indexnamedic, itsdemfromfilledand itsweightfromcover, and set threshold to500.
Model file (TOML)
format = "terraflux/1"

[[nodes]]
id = "filled"
op = "raster.read"
params = { path = "filled.tif" }

[[nodes]]
id = "ndvi_read"
op = "raster.read"
params = { path = "ndvi.tif" }

[[nodes]]
id = "ndvi"
op = "raster.reproject"
inputs = { raster = "ndvi_read.raster" }
params = { crs = "EPSG:32610", resolution = 30, extent = [500010, 4760850, 508110, 4771920], resampling = "bilinear" }

[[nodes]]
id = "cover"
op = "raster.calc"
inputs = { n = "ndvi.raster" }
params = { expression = "0.003 if n > 0.55 else 0.05" }
note = "W: a USLE C per cover (illustrative)."

[[nodes]]
id = "ic"
op = "hydro.connectivity_index"
inputs = { dem = "filled.raster", weight = "cover.map" }
params = { threshold = 500, method = "mfd" }
note = "log10(D_up / D_dn), as InVEST's SDR."
The two weights are illustrative values of the order of a closed forest's and a grassland's C; in a real study, take them from the biophysical table of your land uses (the same table InVEST's sediment model reads) and say where they come from.
hydro.connectivity_index reproduces what InVEST's sediment delivery ratio model does inside: it fills the
DEM, routes water by InVEST's multiple flow directions (method mfd, the default, or d8), computes the
slope gradient as InVEST does and bounds it between 0.005 and 1, raises weights below 0.001 to 0.001, and finds
the streams either from the streams input (1 on the streams) or as the cells whose accumulation reaches the
threshold, in cells. The streams have no value: IC is about the way to them.
A scenario: the riparian forest cleared#
What if the forest along the streams were cleared? Use the HAND of part 2 to find the valley floors and give them the weight of open land:
- Add
hydro.handnamedhand, itsdemfromfilled, with threshold500(it makes its own streams from the D8 accumulation). - Add a
raster.calcnamedclearedwith inputscfromcoverandhfromhand, and the expression0.05 if h < 20 else c: every cell less than 20 m above its stream becomes open land. - Add a second
hydro.connectivity_indexnamedic_cleared, the same asicbut with itsweightfromcleared.
Model file (TOML)
format = "terraflux/1"

[[nodes]]
id = "filled"
op = "raster.read"
params = { path = "filled.tif" }

[[nodes]]
id = "ndvi_read"
op = "raster.read"
params = { path = "ndvi.tif" }

[[nodes]]
id = "ndvi"
op = "raster.reproject"
inputs = { raster = "ndvi_read.raster" }
params = { crs = "EPSG:32610", resolution = 30, extent = [500010, 4760850, 508110, 4771920], resampling = "bilinear" }

[[nodes]]
id = "cover"
op = "raster.calc"
inputs = { n = "ndvi.raster" }
params = { expression = "0.003 if n > 0.55 else 0.05" }

[[nodes]]
id = "hand"
op = "hydro.hand"
inputs = { dem = "filled.raster" }
params = { threshold = 500 }

[[nodes]]
id = "cleared"
op = "raster.calc"
inputs = { c = "cover.map", h = "hand.map" }
params = { expression = "0.05 if h < 20 else c" }

[[nodes]]
id = "ic"
op = "hydro.connectivity_index"
inputs = { dem = "filled.raster", weight = "cover.map" }
params = { threshold = 500 }

[[nodes]]
id = "ic_cleared"
op = "hydro.connectivity_index"
inputs = { dem = "filled.raster", weight = "cleared.map" }
params = { threshold = 500 }


Run to a node with Ctrl+Enter to see its map in the Viewer; a double click keeps it there as a layer. To
compare ic and ic_cleared, choose the other under Compare in the Viewer (a curtain, side by side or
their difference), or subtract them with a raster.calc (b - a).
Save the model as indices.toml beside elevation.tif and ndvi.tif, add a raster.write after each
map you want on disk, and run:
terraflux check indices.toml
terraflux run indices.toml --out output
Read the results#
Wetness. The TWI (FD8) of this map goes from about 5 on the ridges to 13 in the main valleys (1st and 99th percentiles); its median is 6.4. The streams draw continuous dark lines, and the hollows at their heads fan out in lighter blue: the zones of the hillslopes where water converges. Valley floors are much wetter than the rest: the cells less than 5 m above their stream (part 2) have a mean TWI of 11.2, the others 6.7, and the mean falls steadily as HAND rises.
TWI and HAND are related but not interchangeable: their correlation across the map is −0.42. HAND says how high a cell is above the drainage; TWI how much water converges on it. A hollow high on a slope can have a high TWI and a large HAND.

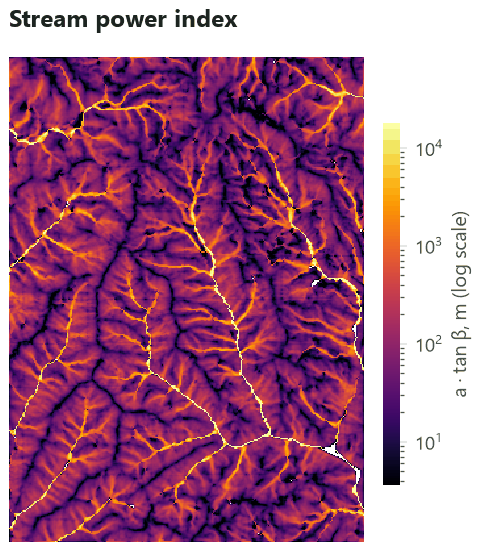

Stream power and sediment transport. SPI spans five orders of magnitude (median 69, the main river several hundred thousand), so map and analyse its logarithm. Its highest values are on the streams themselves, where the index has little meaning for hillslope erosion: mask the streams, or read SPI on the hillslopes and channel heads. STI has a median of 17.8 and 90 % of the map below 39: this steep terrain is, by its shape alone, an erosive one; the cover (forest) is what protects it.
Connectivity. IC ranges from about −7.1 to −3.6 here (1st to 99th percentiles); only the differences mean something. Red cells (high IC) are hillslopes close to a stream along steep paths, and the open patches, whose larger weight (a less protective cover) raises the upslope component and shortens the downslope one; blue cells (low IC) are ridges far from any stream, behind long forested slopes.

Clearing the riparian forest turns 11 % more of the map into open land, all of it on the valley floors. Drag the handle:


On the valley floors (HAND under 20 m) the mean IC rises from −4.71 to −3.19, 1.5 units: sediment reaches the streams some 30 times more easily (\( 10^{1.5} \)). On the slopes above, untouched, it still rises by 0.34 (a factor of 2), because their path to the streams now crosses cleared land. That is the case for riparian buffers in one figure: a strip of forest along the streams protects them from the sediment of the whole hillslope above.
In the literature
For TWI, SPI and STI, report the DEM and its conditioning, the accumulation method (with its exponent), how the specific contributing area was computed (flow width) and how the slope was computed, and what was done with flat cells: Kopecký et al. (2021) found that most studies do not, which makes them impossible to reproduce. For IC, report the weight of every land use and its source, the routing (mfd or d8) and the stream threshold, and compare scenarios on the same DEM.
Settings that change the answer#
The flow method matters for TWI more than any other setting. Move the slider:


The TWI by D8 correlates with the TWI by FD8 at only 0.83 across the map. In a species distribution model, that is a different covariate. Prefer FD8 (Kopecký et al., 2021) unless you have a reason, such as consistency with an earlier study, and test the choice against field measurements when you have them; Sørensen, Zinko & Seibert (2006) found that the best method varied with the variable (species richness, soil pH, groundwater, soil moisture) and the site.
The resolution changes everything: \( a \) grows and slopes flatten as cells grow, and a TWI from a 30 m DEM cannot see the microtopography that a lidar DEM of 1 m sees. Compare TWI only between maps of the same resolution and method.
The stream threshold of IC moves where the paths end. With streams from 9 ha, the paths are shorter and
the mean IC is −5.12; from 45 ha, −5.48; from 225 ha, −5.88. The pattern changes little; the values shift. The
routing matters less: IC by D8 routing correlates with IC by mfd at 0.86. And the weights decide
the contrast between land uses: they are the part to justify best.
Common pitfalls#
- An unprojected DEM for IC.
hydro.connectivity_indextakes the cell size from the map's coordinates; in degrees, the areas and distances are wrong. Reproject first. - Flat cells. Without min_slope, filled flats have no TWI. A model fitted on the cells with a value silently leaves out the wettest places (filled valley bottoms). Set a small floor, or fill the holes.
- SPI on its natural scale. It is so skewed that a regression on it is driven by a few stream cells. Take its logarithm (with a small constant if some cells are 0).
- Comparing with other software. SAGA's "SAGA wetness index", ArcGIS recipes and WhiteboxTools' tools give different numbers for the "same" TWI: different accumulation methods, flow widths and slopes. Report your method, and compare like with like.
- IC between regions. IC depends on the units, the resolution and the weights. Compare scenarios on one map, not absolute values between studies.
- Weights in the wrong range. \( W \) is a cover factor between 0 and 1 (InVEST raises values below 0.001 to 0.001). A weight of 1 for forest and 10 for crops is not a C factor.
Going further#
- Part 1: Depressions, flow directions and flow accumulation and part 2: Streams, watersheds and HAND.
- Part 4: Watershed simulation with SWAT+: erosion and water in tonnes and millimetres, day by day.
- Terrain from an elevation model: slope, curvature and topographic position, the other terrain covariates.
- Species distributions: TWI and HAND as covariates.
- Ecosystem services: InVEST's sediment delivery ratio model, which uses this IC.
- The operators' reference:
hydro.twi,hydro.spi,hydro.sti,hydro.connectivity_index,services.sdr.
References#
- Beven, K. J., & Kirkby, M. J. (1979). A physically based, variable contributing area model of basin hydrology. Hydrological Sciences Bulletin, 24(1), 43–69. https://doi.org/10.1080/02626667909491834
- Borselli, L., Cassi, P., & Torri, D. (2008). Prolegomena to sediment and flow connectivity in the landscape: A GIS and field numerical assessment. Catena, 75(3), 268–277. https://doi.org/10.1016/j.catena.2008.07.006
- Cavalli, M., Trevisani, S., Comiti, F., & Marchi, L. (2013). Geomorphometric assessment of spatial sediment connectivity in small Alpine catchments. Geomorphology, 188, 31–41. https://doi.org/10.1016/j.geomorph.2012.05.007
- Hamel, P., Chaplin-Kramer, R., Sim, S., & Mueller, C. (2015). A new approach to modeling the sediment retention service (InVEST 3.0): Case study of the Cape Fear catchment, North Carolina, USA. Science of the Total Environment, 524–525, 166–177. https://doi.org/10.1016/j.scitotenv.2015.04.027
- Horn, B. K. P. (1981). Hill shading and the reflectance map. Proceedings of the IEEE, 69(1), 14–47. https://doi.org/10.1109/PROC.1981.11918
- Kopecký, M., Macek, M., & Wild, J. (2021). Topographic Wetness Index calculation guidelines based on measured soil moisture and plant species composition. Science of the Total Environment, 757, 143785. https://doi.org/10.1016/j.scitotenv.2020.143785
- Moore, I. D., & Burch, G. J. (1986). Physical basis of the length-slope factor in the Universal Soil Loss Equation. Soil Science Society of America Journal, 50(5), 1294–1298. https://doi.org/10.2136/sssaj1986.03615995005000050042x
- Moore, I. D., Grayson, R. B., & Ladson, A. R. (1991). Digital terrain modelling: A review of hydrological, geomorphological, and biological applications. Hydrological Processes, 5(1), 3–30. https://doi.org/10.1002/hyp.3360050103
- Sørensen, R., Zinko, U., & Seibert, J. (2006). On the calculation of the topographic wetness index: Evaluation of different methods based on field observations. Hydrology and Earth System Sciences, 10(1), 101–112. https://doi.org/10.5194/hess-10-101-2006